

| Tree Zoom | Report Maintenance | |
 The Tree Display settings dialog is used to change settings that affect the tree display and appearance.
The Tree Tab
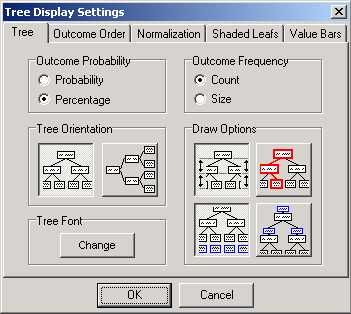
Outcome Probability
By default, the outcome profile shows the probability of that outcome. i.e. the frequency of that outcome to the total of examples in the training set that match the profile. You can choose to show this figure as either a Probability (between 0 and 1) or show it as a Percentage (between 0 and 100).
Outcome Frequency
By default, the outcome profile shows the total number of examples in the training set that match the profile. You can choose to show this as either the absolute Count number of cases or this number can be shown as a ratio Size of the total number of examples in the training set.
Tree Orientation
This sets the display to vertical or horizontal orientation.
Draw Options
Level Tree Outcomes
You can make all the outcome leaf nodes line up, for either vertical or horizontal orientation, to the lowest (or rightmost) leaf node.
Show Tree Path
You can set a red highlight to appear as you select any node in the tree, to illuminate the tree path to that point.
Show Monitored Tables
Toggles the display of Monitored Tables.
Show Intermediate Statistics
Displays frequency and probability information at every intermediate level of the tree (i.e. at every node).
The Outcome Order Tab
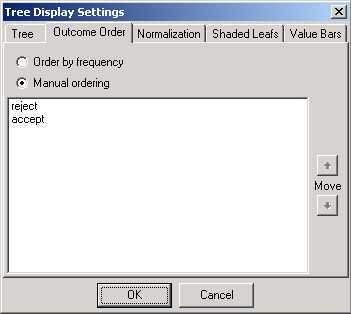
Specify the order in which discrete value outcomes appear at each tree leaf. You can set this to Order by frequency, i.e. the values with highest frequency will appear sorted from the top - for each leaf node. Manual ordering enables you to impose a single order for all leaf nodes.
The Normalization Tab
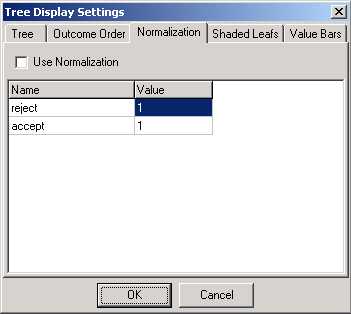
The percentage size and the outcome probability/rate displayed at leafs reflects the training data used. If the training data is a random sample of the domain then these figures represent good approximations of the true values. If the training sample used is biased towards one or more of the outcomes then these figures only represent the training sample and not the real domain.
The main reason why a biased sample is sometimes necessary is where in a large domain, the frequency of some of the outcomes is very small. Therefore any reasonable size sample will only contain a very small number of these rare outcomes.
For example, consider a bank wishing to analyse a database of customers who obtained loans. If the percentage of customers who subsequently defaulted on the loans is for example 5%, then a random sample of 5000 records will only contain some 250 defaulting records, which may prevent the tree from growing very far. If the number of defaulters is to be increased to 2500 then the size of the overall sample will have to be around 50000 examples. Whatever way a biased sample is obtained, the percentage size and probability/rate figures can then be normalised for each data source to reflect the true ratio in the domain by using the Normalisation function. Here, each outcome can be associated with a sampling factor. For example, if the true number of records with a certain outcome is 30000 and in the training sample used it is 2000, then the sampling factor (or multiplier) is 15.00. Note that normalisation will only take effect if the Use Normalisation box is checked. The normalisation process effects the following:
·The selection of the dominant outcome
·The leaf Probability/Rate
·The leaf Percentage size
The Shaded Leafs Tab
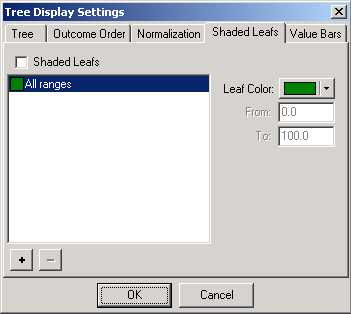
You can apply a color to highlight an outcome with the color intensity set to the probability range of the outcome. The color will be shown on both the tree view and on the secondary Tree Overview window. Your selected color will be applied to the top outcome that was selected using the Outcome Order tab, which could therefore be for a selected outcome or the dominant outcome in each profile leaf node.
The color intensity represents the outcome percentage and is relative to the range of the highest and lowest values in the current tree profiles. i.e. If your highest outcome was 65%, then this will appear as a bar of total color, while your lowest of 34% would have no color. You can also apply different colors to different ranges and click on  , the Leaf Shade Legend icon, to add a window showing the range settings.
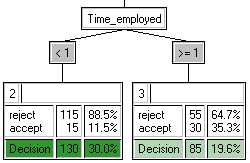
Below is an example where one range intensity of green is being used:
Note that you must tick the Shaded Leafs check box to enable your color setting to be shown on the tree.
The Value Bars Tab
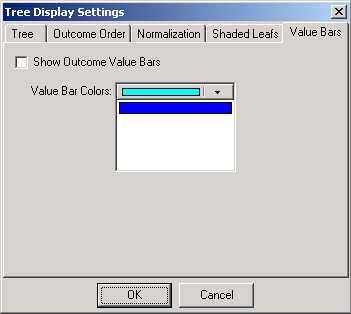
These can be added to the outcome boxes by ticking the Show Outcome Value Bars check box. The colors will be applied to the outcomes in the order that they appear on the Outcome Order tab.